Lars Vogel, (©) 2009 - 2026 vogella GmbH :revnumber: 1.5 :revdate: 26.09.2016
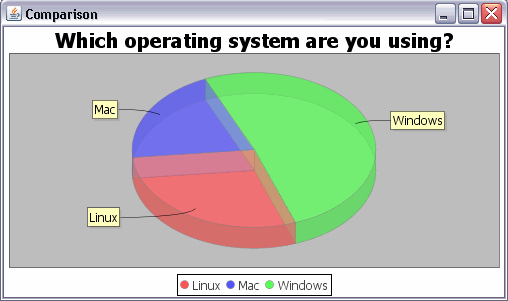
This article describes the usage of the Java library JFreeChart. As example we create a pie chart.
1. Overview
JFreeChart is a free 100% Java chart library created by David Gilbert. JFreeChart makes it easy for developers to display professional quality charts in their applications. For details on JFreeChart please check the following link: https://www.jfree.org/jfreechart/.
2. Download JFreeChart
Download the JFreeChart distribution from the website https://www.jfree.org/jfreechart/.
3. Creating Pie Charts with JFreeChart
3.1. Create Project
Create a new Java project "de.vogella.jfreechart.swing.pie". Create also a package "de.vogella.jfreechart.swing.pie".
3.2. Add jars to build path of your project
In your project create a folder "lib", and paste the JFreeChart jars into this folder.
You only need the following libraries. Please replace the version numbers with the version you are using.
-
jcommon-1.0.16.jar
-
jfreechart-1.0.13.jar
Add these libraries to your classpath. See Eclipse Java IDE - Classpath for details.
3.3. Code
Create the following two classes.
package de.vogella.jfreechart.swing.pie;

import javax.swing.JFrame;

import org.jfree.chart.ChartFactory;
import org.jfree.chart.ChartPanel;
import org.jfree.chart.JFreeChart;
import org.jfree.chart.plot.PiePlot3D;
import org.jfree.data.general.DefaultPieDataset;
import org.jfree.data.general.PieDataset;
import org.jfree.util.Rotation;
package de.vogella.jfreechart.swing.pie;


public class PieChart extends JFrame {

    private static final long serialVersionUID = 1L;

    public PieChart(String applicationTitle, String chartTitle) {
        super(applicationTitle);
        // This will create the dataset
        PieDataset dataset = createDataset();
        // based on the dataset we create the chart
        JFreeChart chart = createChart(dataset, chartTitle);
        // we put the chart into a panel
        ChartPanel chartPanel = new ChartPanel(chart);
        // default size
        chartPanel.setPreferredSize(new java.awt.Dimension(500, 270));
        // add it to our application
        setContentPane(chartPanel);

    }

    /**
     * Creates a sample dataset
     */
    private  PieDataset createDataset() {
        DefaultPieDataset result = new DefaultPieDataset();
        result.setValue("Linux", 29);
        result.setValue("Mac", 20);
        result.setValue("Windows", 51);
        return result;

    }

    /**
     * Creates a chart
     */
    private JFreeChart createChart(PieDataset dataset, String title) {

        JFreeChart chart = ChartFactory.createPieChart3D(
            title,                  // chart title
            dataset,                // data
            true,                   // include legend
            true,
            false
        );

        PiePlot3D plot = (PiePlot3D) chart.getPlot();
        plot.setStartAngle(290);
        plot.setDirection(Rotation.CLOCKWISE);
        plot.setForegroundAlpha(0.5f);
        return chart;

    }
}
package de.vogella.jfreechart.swing.pie;
public class Main {
public static void main(String[] args) {
PieChart demo = new PieChart("Comparison", "Which operating system are you using?");
demo.pack();
demo.setVisible(true);
}
}I assume that the code is pretty much self-explaining. I tried to add lots of comments to make it easier to understand. For more complex examples have a look at the JFreeChart homepage.
| David Gilbert is also selling an excellent developer guide on the JFreeChart homepage. If you are intensively using JFreeChart you should buy the developer guide from David to support him and to get excellent information access. |
4. Links and Literature
4.2. vogella Java example code
If you need more assistance we offer Online Training and Onsite training as well as consulting


