Lars Vogel, (©) 2009 - 2026 vogella GmbH :revnumber: 2.4 :revdate: 30.09.2025
Eclipse Debugging. This article describes how to debug a Java application in Eclipse.
1. Overview
1.1. What is debugging?
Debugging allows you to run a program interactively while watching the source code and the variables during the execution.
A breakpoint in the source code specifies where the execution of the program should stop during debugging. Once the program is stopped you can investigate variables, change their content, etc.
To stop the execution, if a field is read or modified, you can specify watchpoints.
|
Breakpoints and watchpoints are sometimes called stop points. |
1.2. Debugging support in Eclipse
Eclipse allows you to start a Java program in Debug mode.
Eclipse provides a Debug perspective which gives you a pre-configured set of views. Eclipse allows you to control the execution flow via debug commands.
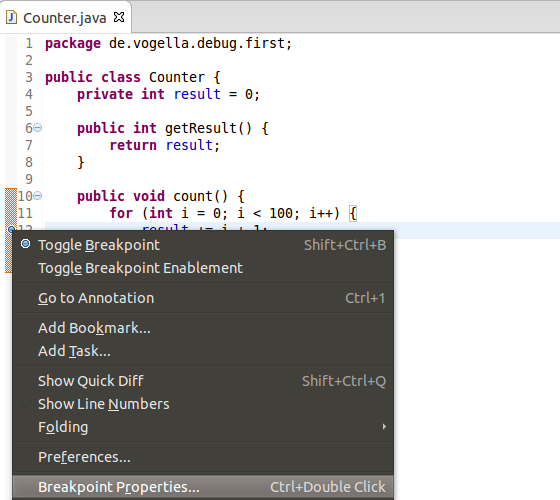
1.3. Setting Breakpoints
To define a breakpoint in your source code, right-click in the left margin in the Java editor and select Toggle Breakpoint. Alternatively, you can double-click on this position.
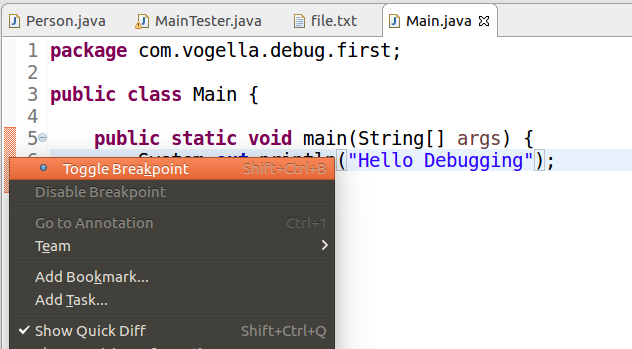
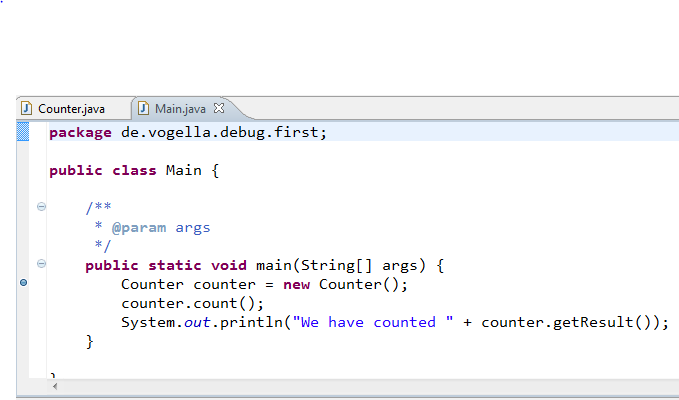
For example, in the following screenshot we set a breakpoint on
the
line
Counter counter = new Counter();.
1.4. Starting the Debugger
To debug your application, select a Java file with a main method. Right-click on it and select .
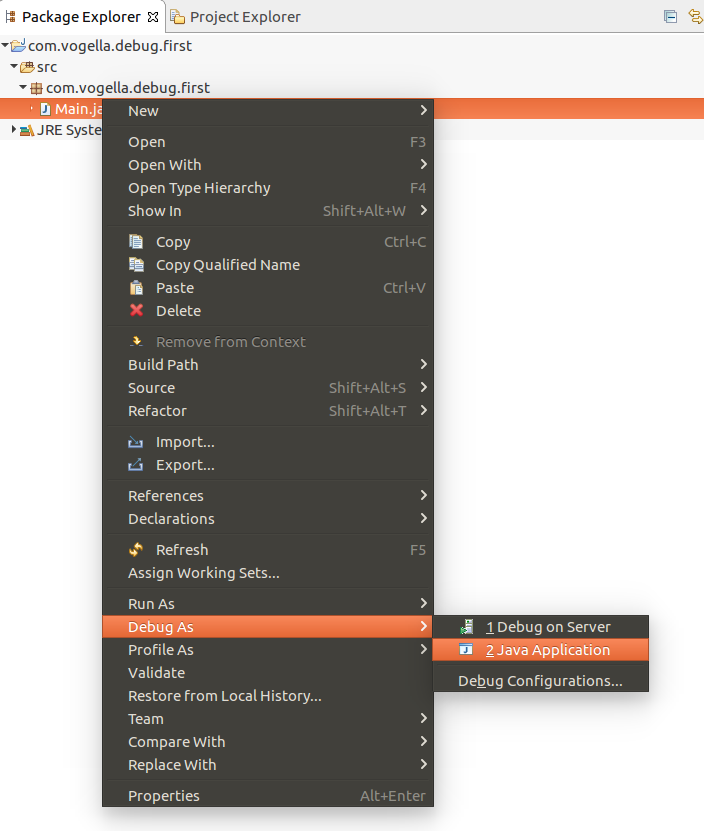
|
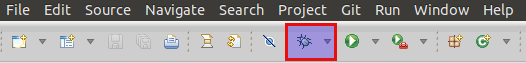
If you started an application once via the context menu, you can use the created launch configuration again via the Debug button in the Eclipse toolbar. |
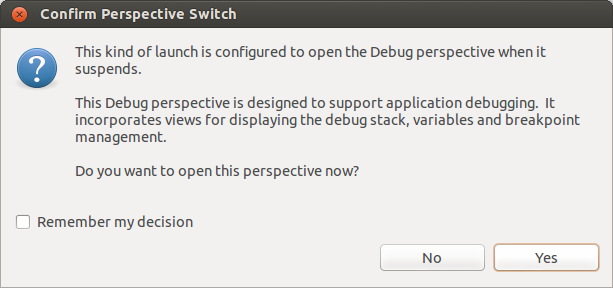
If you have not defined any breakpoints, program as normally. To debug the program you need to define breakpoints. Eclipse asks you to switch to the Debug perspective once a stop point is reached. Answer Yes in the corresponding dialog. Afterwards, Eclipse opens this perspective.
1.5. Controlling the program execution
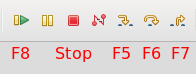
Eclipse provides buttons in the toolbar for controlling the execution of the program you are debugging. Typically, it is easier to use the corresponding keys to control this execution.
You can use allow use shortcut key to step through your coding. The meaning of these keys is explained in the following table.
| Key | Description |
|---|---|
F5 |
Executes the currently selected line and goes to the next line in your program. If the selected line is a method call the debugger steps into the associated code. |
F6 |
F6 steps over the call, i.e. it executes a method without stepping into it in the debugger. |
F7 |
F7 steps out to the caller of the currently executed method. This finishes the execution of the current method and returns to the caller of this method. |
F8 |
F8 tells the Eclipse debugger to resume the execution of the program code until is reaches the next breakpoint or watchpoint. |
The following picture displays the buttons and their related keyboard shortcuts.
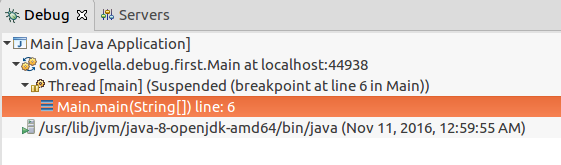
The call stack shows the parts of the program that are currently executed and how they relate to each other. The current stack is displayed in the Debug view.
1.6. Breakpoints view and deactivating breakpoints
The Breakpoints view allows you to delete and deactivate breakpoints and watchpoints. You can modify their properties.
To deactivate a breakpoint, remove the corresponding checkbox in the Breakpoints view. To delete it you can use the corresponding buttons in the view toolbar. These options are depicted in the following screenshot.
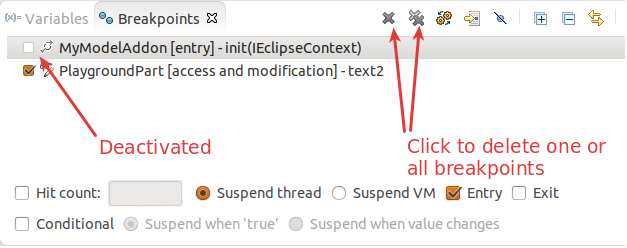
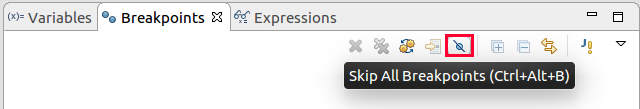
If you want to disable all breakpoints at the same time, you can press the Skip all breakpoints button. If you press it again, your breakpoints are reactivated. This button is highlighted in the following screenshot.
1.7. Evaluating variables in the debugger
The Variables view displays fields and local variables from the current executing stack. Please note you need to run the debugger to see the variables in this view.
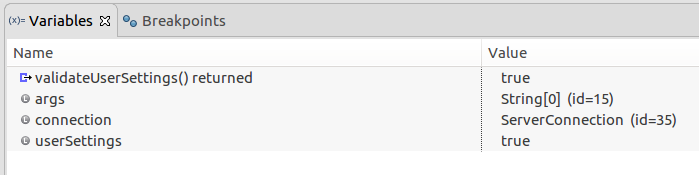
|
As of Eclipse 4.7 you see the return statement of the last method call in the debugger. |
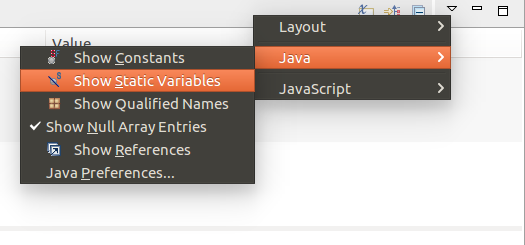
Use the drop-down menu to display static variables.
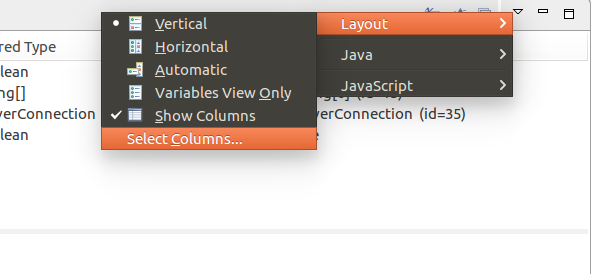
Via the drop-down menu of the Variables view you can customize the displayed columns.
For example, you can show the actual type of each variable declaration. For this select .
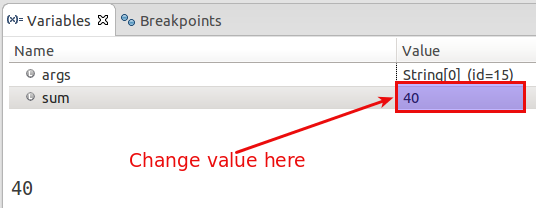
1.8. Changing variable assignments in the debugger
The Variables view allows you to change the values assigned to your variable at runtime. This is depicted in the following screenshot.
1.9. Controlling the display of the variables with Detail Formatter
By default, the Variables view uses the toString() method to determine how to display the variable.
You can define a Detail Formatter in which you can use Java code to define how a variable is displayed.
For example, the toString() method in the Counter class may show meaningless information, e.g., com.vogella.combug.first.Counter@587c94.
To make this output more readable you can right-click on the corresponding variable and select the New Detail Formater… entry from the context menu.
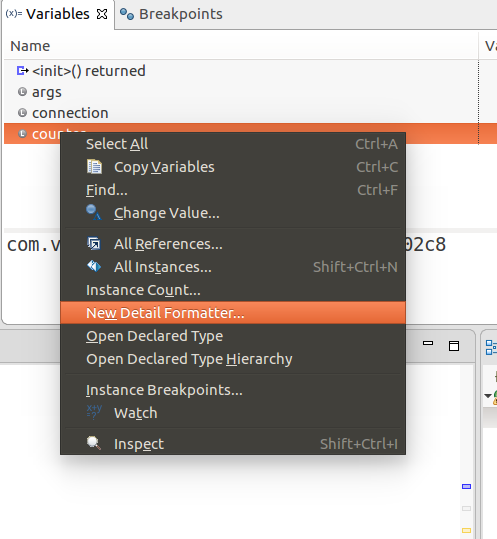
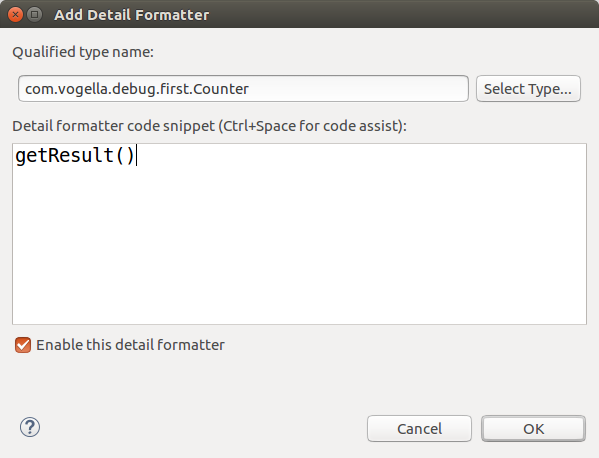
Afterwards, you can use a method of this class to determine the output.
In this example, the getResult() method of this class is used.
This setup is depicted in the following screenshot.
2. Advanced Debugging
The following section shows more options you have for debugging.
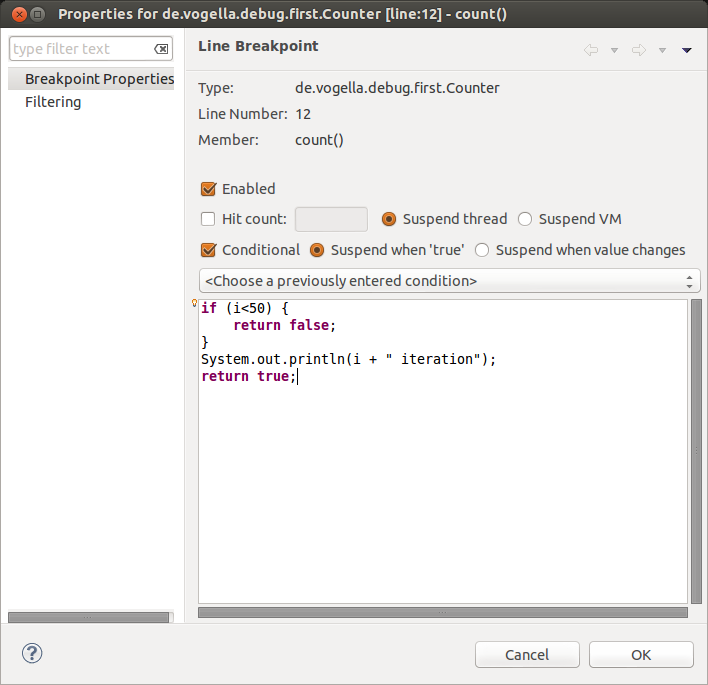
2.1. Breakpoint properties
After setting a breakpoint you can select the properties of the breakpoint, via . Via the breakpoint properties you can define a condition that restricts the activation of this breakpoint.
You can for example specify that a breakpoint should only become active after it has reached 12 or more times via the Hit Count property.
You can create a conditional expression. The execution of the program only stops at the breakpoint, if the condition evaluates to true. This mechanism can be used for additional logging, as the code that specifies the condition is executed every time the program execution reaches that point.
The following screenshot depicts this setting.
2.2. Watchpoint
A watchpoint is a breakpoint set on a field. The debugger will stop whenever that field is read or changed.
You can set a watchpoint by double-clicking on the left margin, next to the field declaration. In the properties of a watchpoint you can configure if the execution should stop during read access (Field Access) or during write access (Field Modification) or both.
2.3. Exception breakpoints
You can set breakpoints for thrown exceptions. To define an exception breakpoint click on the Add Java Exception Breakpoint button icon in the Breakpoints view toolbar.

You can configure, if the debugger should stop at caught or uncaught exceptions.
2.4. Method breakpoint
A method breakpoint is defined by double-clicking in the left margin of the editor next to the method header.
You can configure if you want to stop the program before entering or after leaving the method.
2.5. Breakpoints for loading classes
A class load breakpoint stops when the class is loaded.
To set a class load breakpoint, right-click on a class in the Outline view and choose the Toggle Class Load Breakpoint option.
Alternatively, you can double-click in the left border of the Java editor beside the class definition.
2.6. Step Filter
You can define that certain packages should be skipped in debugging. This is useful if you use a framework for testing but do not want to step into the test framework classes. These packages can be configured via the menu path.
2.7. Hit Count
For every breakpoint you can specify a hit count in its properties. The application is stopped once the breakpoint has been reached the number of times defined in the hit count.
2.8. Remote debugging
Eclipse allows you to debug applications which runs on another Java Virtual Machine or even on another machine.
To enable remote debugging you need to start your Java application with certain flags, as demonstrated in the following code example.
java -Xdebug -Xnoagent \
-Djava.compiler=NONE \
-Xrunjdwp:transport=dt_socket,server=y,suspend=y,address=5005
In you Eclipse IDE you can enter the hostname and port to connect for debugging via the menu.
Here you can create a new debug configuration of the_Remote Java Application_ type. This configuration allows you to enter the hostname and port for the connection as depicted in the following screenshot.
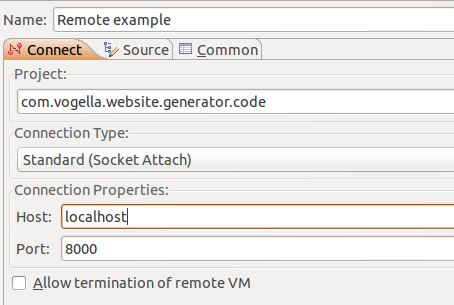
| Remote debugging requires that you have the source code of the application that is debugged available in your Eclipse IDE. |
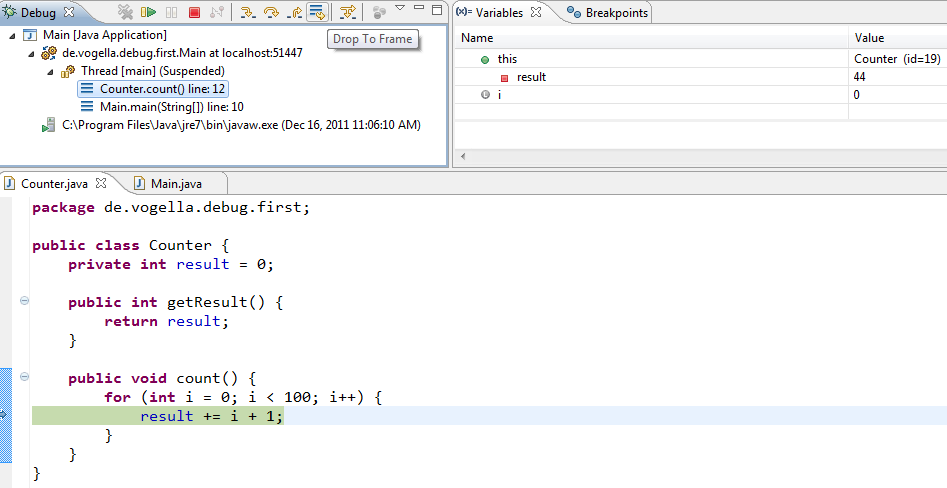
2.9. Drop to frame
Eclipse allows you to select any level (frame) in the call stack during debugging and set the JVM to restart from that point.
This allows you to rerun a part of your program. Be aware that variables that have been modified by code that already run will remain modified.
To use this feature, select a level in your stack and press the Drop to Frame button in the toolbar of the Debug view.
| Fields and external data may not be affected by the reset. For example, if you write a entry to the database and afterward drop to a previous frame, this entry is still in the database. |
The following screenshot depicts such a reset.
If you restart your for loop, the field result is not set to its initial value and therefore the loop is not executed as without resetting the execution to a previous point.
3. Exercise: Create Project for debugging
3.1. Create Project
To practice debugging create a new Java project called
de.vogella.combug.first. Also create
the package
de.vogella.combug.first
and create
the following classes.
package de.vogella.combug.first;

public class Counter {
  private int result = 0;

  public int getResult() {
    return result;
  }

  public void count() {
    for (int i = 0; i < 100; i++) {
      result += i + 1;
    }
  }
}
package de.vogella.combug.first;
public class Main {
/**
* @param args
*/
public static void main(String[] args) {
Counter counter = new Counter();
counter.count();
System.out.println("We have counted "
+ counter.getResult());
}
}3.2. Debugging
Set a breakpoint in the
Counter
class. Debug your program and follow the execution of the
count
method.
Define a
Detailed Formatter
for your
Counter
that uses the
getResult
method. Debug your program again and verify that your new formatter
is used.
Delete your breakpoint and add a breakpoint for class loading. Debug your program again and verify that the debugger stops when your class is loaded.
4. Links and Literature
4.2. vogella Java example code
If you need more assistance we offer Online Training and Onsite training as well as consulting